
ဖိုင်:Timeline of US overdose deaths involving heroin, by other opioid involvement.jpg

ဤနမူနာ၏ အရွယ်အစား - ၈၀၀ × ၆၀၀ ပစ်ဇယ်။ အခြား ပုံရိပ်ပြတ်သားမှု: ၃၂၀ × ၂၄၀ ပစ်ဇယ် | ၆၄၀ × ၄၈၀ ပစ်ဇယ် | ၁၀၂၄ × ၇၆၈ ပစ်ဇယ် | ၁၂၀၀ × ၉၀၀ ပစ်ဇယ်။
မူရင်းဖိုင် (၁၂၀၀ × ၉၀၀ pixels, ဖိုင်အရွယ်အစား - ၁၈၈ KB, MIME အမျိုးအစား image/jpeg)
| ဤဖိုင်သည် Wikimedia Commons မှဖြစ်ပြီး အခြားပရောဂျက်များတွင် သုံးကောင်းသုံးလိမ့်မည်။ ယင်း၏ ဖိုင်အကြောင်းစာမျက်နှာ တွင် ဖော်ပြထားချက်ကို အောက်တွင် ပြထားသည်။ Commons သည် မူပိုင်ခွင့်လွတ်လပ်သော မီဒီယာဖိုင်များ သိုလှောင်ထားရာ နေရာ ဖြစ်သည်။ သင်လည်း ပါဝင်ကူညီနိုင်ပါသည်။ |

|
File:US timeline. Heroin deaths.svg is a vector version of this file. It should be used in place of this JPG file when not inferior.
File:Timeline of US overdose deaths involving heroin, by other opioid involvement.jpg → File:US timeline. Heroin deaths.svg
For more information, see Help:SVG. |
 |
အကျဉ်းချုပ်
| ဖော်ပြချက် |
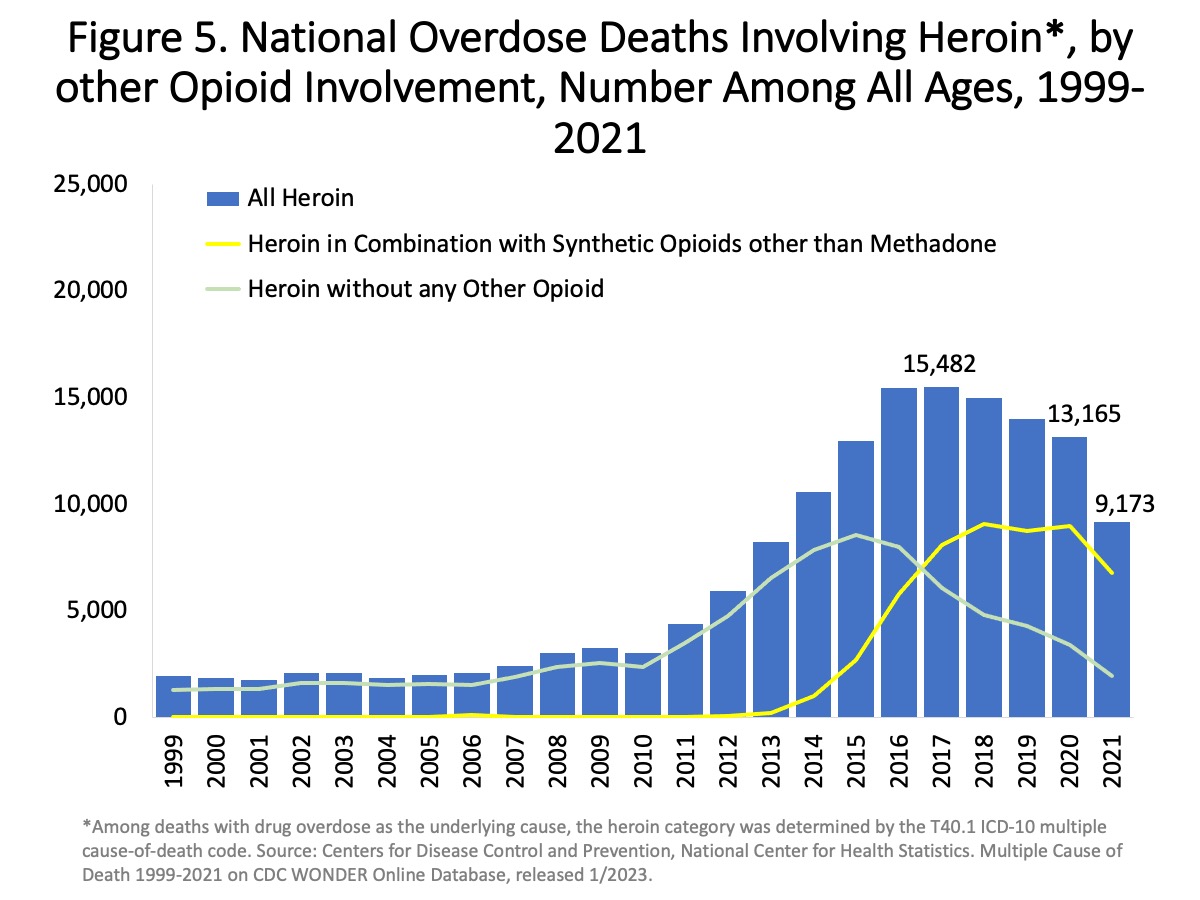
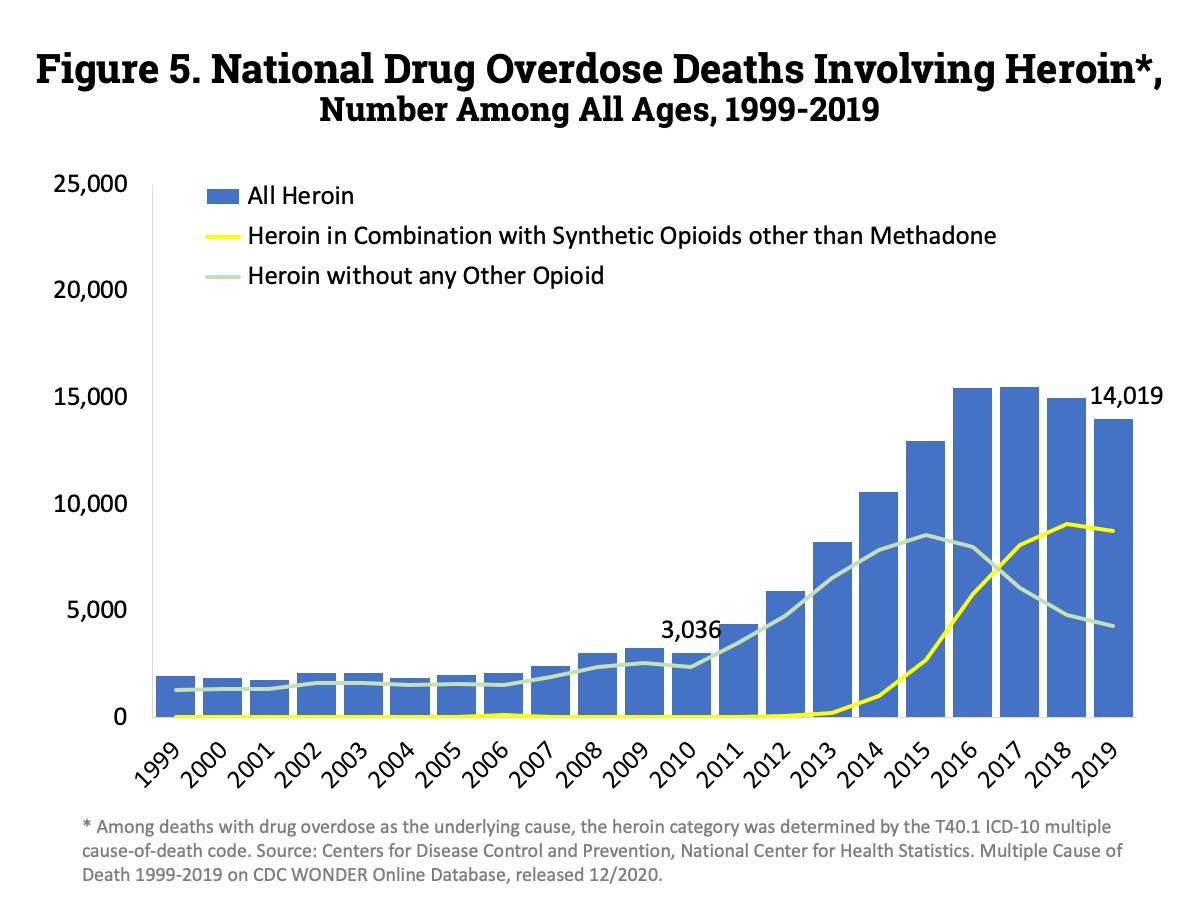
English: "Figure 5. National Overdose Deaths Involving Heroin, by Other Opioid Involvement—Number Among All Ages, 1999-2021. The figure above is a bar and line graph showing the total number of U.S. overdose deaths involving heroin from 1999 to 2021. Drug overdose deaths involving heroin rose from 1,960 in 1999 to 15,482 in 2017 before trending down to 13,165 deaths in 2020 and 9,173 deaths in 2021. The bars are overlaid by lines showing the number of deaths involving heroin in combination with synthetic opioids other than methadone (primarily fentanyl) or without any other opioid from 1999 to 2021 (Source: CDC WONDER)." |
| ရက်စွဲ | - date of first upload to the Commons. See file history for dates of later uploads. |
| ရင်းမြစ် | Overdose Death Rates. By National Institute on Drug Abuse (NIDA). 1999-2021 chart. 1999-2019 chart. 2002-2017 chart. 2002-2015 chart. 2001-2014 chart. |
| စာရေးသူ | National Institute on Drug Abuse. Some versions of the chart were cropped, and have had "USA" added to them. Freeware IrfanView, etc. can be used. See Commons:Convert tables and charts to wiki code or image files, and the section about adding text to chart images. |
လိုင်စင်သတ်မှတ်ခြင်း
This image is a work of the National Institutes of Health, part of the United States Department of Health and Human Services, taken or made as part of an employee's official duties. As a work of the U.S. federal government, the image is in the public domain.
 |
||
| This file has been identified as being free of known restrictions under copyright law, including all related and neighboring rights. | ||
ဖိုင်မှတ်တမ်း
ဖိုင်ကို ယင်းနေ့စွဲ အတိုင်း မြင်နိုင်ရန် နေ့စွဲ/အချိန် တစ်ခုခုပေါ်တွင် ကလစ်နှိပ်ပါ။
| နေ့စွဲ/အချိန် | နမူနာပုံငယ် | မှတ်တမ်း ဒိုင်မန်းရှင်းများ | အသုံးပြုသူ | မှတ်ချက် | |
|---|---|---|---|---|---|
| ကာလပေါ် | ၀၀:၀၀၊ ၂၂ ဇူလိုင် ၂၀၂၃ | | ၁၂၀၀ × ၉၀၀ (၁၈၈ KB) | Timeshifter | Latest |
| ၀၈:၅၂၊ ၃၁ ဩဂုတ် ၂၀၂၁ |  | ၁၁၅၀ × ၈၆၅ (၁၈၄ KB) | Timeshifter | Latest chart from source. | |
| ၁၅:၂၃၊ ၆ စက်တင်ဘာ ၂၀၁၈ |  | ၈၁၀ × ၅၈၉ (၉၄ KB) | Timeshifter | newer chart | |
| ၁၀:၅၁၊ ၂၇ မတ် ၂၀၁၇ |  | ၇၉၄ × ၆၃၆ (၉၁ KB) | Timeshifter | 2015 column. | |
| ၁၁:၁၁၊ ၁ ဇန်နဝါရီ ၂၀၁၆ |  | ၇၉၁ × ၅၈၆ (၈၄ KB) | Timeshifter | User created page with UploadWizard |
ဖိုင်သုံးစွဲမှု
ဤဖိုင်ကို အသုံးပြုထားသော စာမျက်နှာများမရှိပါ။
ဂလိုဘယ် ဖိုင်သုံးစွဲမှု
အောက်ပါ အခြားဝီကီများတွင် ဤဖိုင်ကို အသုံးပြုထားသည်-
- ar.wikipedia.org တွင် အသုံးပြုမှု
- en.wikipedia.org တွင် အသုံးပြုမှု
- es.wikipedia.org တွင် အသုံးပြုမှု
- hy.wikipedia.org တွင် အသုံးပြုမှု
- ja.wikipedia.org တွင် အသုံးပြုမှု
- sr.wikipedia.org တွင် အသုံးပြုမှု
- vi.wikipedia.org တွင် အသုံးပြုမှု
- zh.wikipedia.org တွင် အသုံးပြုမှု