ဖိုင်:Conjugate-unit-hyperbolas.svg

အခြားဘာသာစကားများဖြင့် စာမျက်နှာအကြောင်းအရာများကို ပံ့ပိုးမထားပါ။
This is a file from the Wikimedia Commons
ဝီကီပီးဒီးယား မှ

မူရင်းဖိုင်(SVG ဖိုင်, ၆၃၀ × ၆၃၀ pixels ကို အကြံပြုသည်, ဖိုင်အရွယ်အစား - ၁၀၄ KB)

အကျဉ်းချုပ်

ဖော်ပြချက်
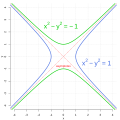
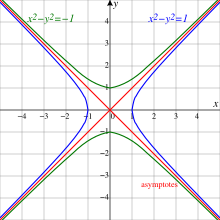
English: The rectangular hyperbola x^2 - y^2 and its conjugate, having the same asymptotes.
ရက်စွဲ
ရင်းမြစ် ကိုယ်ပိုင်ဖန်တီးမှု
စာရေးသူ Melikamp
အခြား ဗားရှင်းများ
Drini-conjugatehyperbolas

လိုင်စင်သတ်မှတ်ခြင်း

ကျွန်ုပ်၊ ဤလုပ်ဆောင်ချက်၏ မူပိုင်ခွင့်ပိုင်ရှင်အနေဖြင့် ဤနေရာမှ အောက်ပါလိုင်စင်အောက်တွင် ထုတ်လွှင့်ပါသည်:
w:my:Creative Commons
မှတ်ယူနိုင်ခြင်း ထပ်တူမျှဝေ
ဤဖိုင်သည် Creative Commons Attribution-Share Alike 4.0 နိုင်ငံတကာ လိုင်စင်အောက်တွင် လိုင်စင်သတ်မှတ်ထားပါသည်။
သင်သည် လွတ်လပ်စွာ:
  • မျှဝေရန် – ဖန်တီးမှုကို ကူးယူရန်၊ ဖြန့်ဖြူးရန်နှင့် ထုတ်လွှင့်ရန်
  • ပြန်ရောနှောရန် – ဖန်တီးမှုကို ပြင်ဆင်ညှိနှိုင်းရန်
အောက်ပါ အခြေအနေများတွင်:
  • မှတ်ယူနိုင်ခြင်း – ပြောင်းလဲမှုများ ပြုလုပ်ခဲ့ပါက ဖန်တီးသူ သို့မဟုတ် လိုင်စင်ရှိသူမှ သတ်မှတ်သော အမျိုးအစားကို လိုက်နာရမည် (ဆိုလိုသည်မှာ သင့်အား သို့မဟုတ် သင့်ဖန်တီးမှုတွင် အသုံးပြုခြင်းအား ထောက်ခံချက်ပေးသည်ဟု မဆိုလိုပါ)။
  • ထပ်တူမျှဝေ – ဤဖန်တီးမှုအား ပြင်ဆင်ခြင်း၊ ပြောင်းလဲခြင်း သို့မဟုတ် ထပ်ဆင့် ဖန်တီးခြင်း ပြုလုပ်ပါက ရရှိလာသော ဖန်တီးမှုကို ဤဖန်တီးမှုနှင့် သို့မဟုတ် ဆင်တူသော လိုင်စင်ဖြင့်သာ ဖြန့်ချိသင့်သည်။

R code

library(svglite)
svg("conjugate-unit-hyperbolas.svg")

r = 4 # max |x| and |y|
res = 100 # plotting resolution per unit
colg = "gray"
colx = "springgreen4"
coly = "royalblue"
cola = "red"

par(mar = c(3, 3, 1, 1))
plot.new()
plot.window(c(-r, r), c(-r, r))

# axes
axis(1, -r:r)
axis(2, -r:r)
mtext("x", side=1, line=2)
mtext("y", side=2, line=2)

# grid
abline(h = -r:r, lty=3, col=colg)
abline(v = -r:r, lty=3, col=colg)

# asymptotes
abline(0, 1, lty=3, col=cola, lwd=1.5)
abline(0, -1, lty=3, col=cola, lwd=1.5)

# curves
x = (((-r-0.2)*res):((r+0.2)*res))/res
lines(x, sqrt(1+x^2), col=colx, lwd=3)
lines(x, -sqrt(1+x^2), col=colx, lwd=3)
lines(sqrt(1+x^2), x, col=coly, lwd=3)
lines(-sqrt(1+x^2), x, col=coly, lwd=3)

# labels
text(-0.2, 2.5, expression("x"^2 - "y"^2 == -1), cex=2.3, col=colx)
text(2.7, -0.5, expression("x"^2 - "y"^2 == 1), cex=2.3, col=coly)
text(0, -0.8, "asymptotes", col=cola)

dev.off()

ပုံစာများ

ဤဖိုင်၏ဆိုလိုရင်းကို စာတစ်ကြောင်းရှင်းလင်းချက်ဖြင့် ထည့်သွင်းရန်
Conjugate unit hyperbolas

Items portrayed in this file

depicts အင်္ဂလိပ်

media type အင်္ဂလိပ်

image/svg+xml

checksum အင်္ဂလိပ်

718b41f593731141d38f29e805645de4eb9b2ddf

determination method အင်္ဂလိပ်: SHA-1 အင်္ဂလိပ်

data size အင်္ဂလိပ်

၁၀၆၄၇၇ ဘိုက်

height အင်္ဂလိပ်

၆၃၀ pixel

width အင်္ဂလိပ်

၆၃၀ pixel

ဖိုင်မှတ်တမ်း

ဖိုင်ကို ယင်းနေ့စွဲ အတိုင်း မြင်နိုင်ရန် နေ့စွဲ/အချိန် တစ်ခုခုပေါ်တွင် ကလစ်နှိပ်ပါ။

နေ့စွဲ/အချိန်နမူနာပုံငယ်မှတ်တမ်း ဒိုင်မန်းရှင်းများအသုံးပြုသူမှတ်ချက်
ကာလပေါ် ၂၁:၄၂၊ ၂၂ မတ် ၂၀၂၄ ၂၁:၄၂၊ ၂၂ မတ် ၂၀၂၄ ရက်က မူအတွက် နမူနာပုံငယ်၆၃၀ × ၆၃၀ (၁၀၄ KB)Melikampbetter green
၁၇:၅၂၊ ၂၁ မတ် ၂၀၂၄ ၁၇:၅၂၊ ၂၁ မတ် ၂၀၂၄ ရက်က မူအတွက် နမူနာပုံငယ်၆၃၀ × ၆၃၀ (၁၀၄ KB)MelikampUploaded own work with UploadWizard

ဤဖိုင်ကို အသုံးပြုထားသော စာမျက်နှာများမရှိပါ။

ဂလိုဘယ် ဖိုင်သုံးစွဲမှု

အောက်ပါ အခြားဝီကီများတွင် ဤဖိုင်ကို အသုံးပြုထားသည်-

မီတာဒေတာ