ဖိုင်:Binary Boiling Point Diagram new.svg

အခြားဘာသာစကားများဖြင့် စာမျက်နှာအကြောင်းအရာများကို ပံ့ပိုးမထားပါ။
This is a file from the Wikimedia Commons
ဝီကီပီးဒီးယား မှ

မူရင်းဖိုင်(SVG ဖိုင်, ၃၉၁ × ၃၇၈ pixels ကို အကြံပြုသည်, ဖိုင်အရွယ်အစား - ၂၃ KB)

Render this image in .
ဖော်ပြချက်
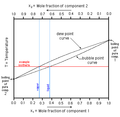
English: Binary Boiling Point Diagram (graph) of a hypothetical mixture of two components without an azeotrope. An example isotherm line is shown to compare vapor and liquid compositions at that temperature.
Русский: График температур кипения некоторой смеси двух не образующих азеотропную смесь компонентов. Приведён пример линии изотермы для сравнения составов пара и жидкости при этой температуре.
ရက်စွဲ (UTC)
ရင်းမြစ်
စာရေးသူ
အခြား ဗားရှင်းများ

[ပြင်ဆင်ရန်]


.svg:

.png:


Derivative works of this file:


This is a retouched picture, which means that it has been digitally altered from its original version. Modifications: vectorized. The original can be viewed here: Binary Boiling Point Diagram.PNG. Modifications made by Michbich.

ကျွန်ုပ်၊ ဤလုပ်ဆောင်ချက်၏ မူပိုင်ခွင့်ပိုင်ရှင်အနေဖြင့် ဤနေရာမှ အောက်ပါလိုင်စင်အောက်တွင် ထုတ်လွှင့်ပါသည်:
w:my:Creative Commons
မှတ်ယူနိုင်ခြင်း ထပ်တူမျှဝေ
ဤဖိုင်သည် Creative Commons Attribution-Share Alike 2.5 Generic လိုင်စင်အောက်တွင် လိုင်စင်သတ်မှတ်ထားပါသည်။
သင်သည် လွတ်လပ်စွာ:
  • မျှဝေရန် – ဖန်တီးမှုကို ကူးယူရန်၊ ဖြန့်ဖြူးရန်နှင့် ထုတ်လွှင့်ရန်
  • ပြန်ရောနှောရန် – ဖန်တီးမှုကို ပြင်ဆင်ညှိနှိုင်းရန်
အောက်ပါ အခြေအနေများတွင်:
  • မှတ်ယူနိုင်ခြင်း – ပြောင်းလဲမှုများ ပြုလုပ်ခဲ့ပါက ဖန်တီးသူ သို့မဟုတ် လိုင်စင်ရှိသူမှ သတ်မှတ်သော အမျိုးအစားကို လိုက်နာရမည် (ဆိုလိုသည်မှာ သင့်အား သို့မဟုတ် သင့်ဖန်တီးမှုတွင် အသုံးပြုခြင်းအား ထောက်ခံချက်ပေးသည်ဟု မဆိုလိုပါ)။
  • ထပ်တူမျှဝေ – ဤဖန်တီးမှုအား ပြင်ဆင်ခြင်း၊ ပြောင်းလဲခြင်း သို့မဟုတ် ထပ်ဆင့် ဖန်တီးခြင်း ပြုလုပ်ပါက ရရှိလာသော ဖန်တီးမှုကို ဤဖန်တီးမှုနှင့် သို့မဟုတ် ဆင်တူသော လိုင်စင်ဖြင့်သာ ဖြန့်ချိသင့်သည်။

မူရင်းတင်ထားသောမှတ်တမ်း

This image is a derivative work of the following images:

  • File:Binary_Boiling_Point_Diagram.PNG licensed with Cc-by-sa-2.5
    • 2007-03-18T22:36:14Z H Padleckas 380x370 (5721 Bytes) revised previous diagram slightly adding lines to show X2 composition
    • 2007-01-25T02:09:10Z Pngbot 380x370 (3006 Bytes) optimized with optipng
    • 2006-11-21T17:01:03Z H Padleckas 380x370 (8980 Bytes) Binary Boiling Point Diagram

Uploaded with derivativeFX

ပုံစာများ

ဤဖိုင်၏ဆိုလိုရင်းကို စာတစ်ကြောင်းရှင်းလင်းချက်ဖြင့် ထည့်သွင်းရန်

Items portrayed in this file

depicts အင်္ဂလိပ်

media type အင်္ဂလိပ်

image/svg+xml

checksum အင်္ဂလိပ်

3dd51853706e21e9f5457804d2281c92ad91ffb9

determination method အင်္ဂလိပ်: SHA-1 အင်္ဂလိပ်

data size အင်္ဂလိပ်

၂၃၀၅၇ ဘိုက်

height အင်္ဂလိပ်

၃၇၈ pixel

width အင်္ဂလိပ်

၃၉၁ pixel

ဖိုင်မှတ်တမ်း

ဖိုင်ကို ယင်းနေ့စွဲ အတိုင်း မြင်နိုင်ရန် နေ့စွဲ/အချိန် တစ်ခုခုပေါ်တွင် ကလစ်နှိပ်ပါ။

နေ့စွဲ/အချိန်နမူနာပုံငယ်မှတ်တမ်း ဒိုင်မန်းရှင်းများအသုံးပြုသူမှတ်ချက်
ကာလပေါ် ၀၉:၃၃၊ ၁၈ နိုဝင်ဘာ ၂၀၂၀ ၀၉:၃၃၊ ၁၈ နိုဝင်ဘာ ၂၀၂၀ ရက်က မူအတွက် နမူနာပုံငယ်၃၉၁ × ၃၇၈ (၂၃ KB)HugoFile uploaded using svgtranslate tool (https://svgtranslate.toolforge.org/). Added translation for cs.
၁၀:၀၀၊ ၁၀ နိုဝင်ဘာ ၂၀၀၉ ၁၀:၀၀၊ ၁၀ နိုဝင်ဘာ ၂၀၀၉ ရက်က မူအတွက် နမူနာပုံငယ်၃၉၁ × ၃၇၈ (၂၀ KB)Michbichonce more
၀၉:၅၈၊ ၁၀ နိုဝင်ဘာ ၂၀၀၉ ၀၉:၅၈၊ ၁၀ နိုဝင်ဘာ ၂၀၀၉ ရက်က မူအတွက် နမူနာပုံငယ်၃၉၁ × ၃၇၈ (၂၀ KB)Michbichtried fixing the fonts
၀၉:၅၆၊ ၁၀ နိုဝင်ဘာ ၂၀၀၉ ၀၉:၅၆၊ ၁၀ နိုဝင်ဘာ ၂၀၀၉ ရက်က မူအတွက် နမူနာပုံငယ်၃၉၁ × ၃၇၈ (၁၉ KB)Michbich{{Information |Description={{en|Binary Boiling Point Diagram (graph) of a hypothetical mixture of two components '''without''' an azeotrope. An example isotherm line is shown to compare vapor and liquid compositions at that temperature.}} |Source=*[[:Fil

ဤဖိုင်ကို အသုံးပြုထားသော စာမျက်နှာများမရှိပါ။

ဂလိုဘယ် ဖိုင်သုံးစွဲမှု

အောက်ပါ အခြားဝီကီများတွင် ဤဖိုင်ကို အသုံးပြုထားသည်-

မီတာဒေတာ