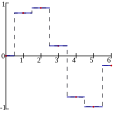
ဖိုင်:Piecewise constant.svg

Size of this PNG preview of this SVG file: ၆၀၀ × ၄၈၀ ပစ်ဇယ်. အခြား ပုံရိပ်ပြတ်သားမှု: ၃၀၀ × ၂၄၀ ပစ်ဇယ် | ၉၆၀ × ၇၆၈ ပစ်ဇယ် | ၁၂၈၀ × ၁၀၂၄ ပစ်ဇယ် | ၂၅၆၀ × ၂၀၄၈ ပစ်ဇယ်။
မူရင်းဖိုင် (SVG ဖိုင်, ၆၀၀ × ၄၈၀ pixels ကို အကြံပြုသည်, ဖိုင်အရွယ်အစား - ၅ KB)
ဖိုင်မှတ်တမ်း
ဖိုင်ကို ယင်းနေ့စွဲ အတိုင်း မြင်နိုင်ရန် နေ့စွဲ/အချိန် တစ်ခုခုပေါ်တွင် ကလစ်နှိပ်ပါ။
| နေ့စွဲ/အချိန် | နမူနာပုံငယ် | မှတ်တမ်း ဒိုင်မန်းရှင်းများ | အသုံးပြုသူ | မှတ်ချက် | |
|---|---|---|---|---|---|
| ကာလပေါ် | ၁၆:၀၀၊ ၂၃ ဇွန် ၂၀၀၇ |  | ၆၀၀ × ၄၈၀ (၅ KB) | Berland | == Summary == {{Information |Description=Illustration of constant interpolation, more precisely en:Nearest neighbor interpolation on the same dataset as listed in Interpolation. |Source=self-made in Gnuplot |Dat |
| ၁၅:၅၅၊ ၂၃ ဇွန် ၂၀၀၇ |  | ၄၂၉ × ၄၂၅ (၁၆ KB) | Cronholm144 | made svg |
ဖိုင်သုံးစွဲမှု
ဤဖိုင်ကို အသုံးပြုထားသော စာမျက်နှာများမရှိပါ။
ဂလိုဘယ် ဖိုင်သုံးစွဲမှု
အောက်ပါ အခြားဝီကီများတွင် ဤဖိုင်ကို အသုံးပြုထားသည်-
- ar.wikipedia.org တွင် အသုံးပြုမှု
- bs.wikipedia.org တွင် အသုံးပြုမှု
- ca.wikipedia.org တွင် အသုံးပြုမှု
- de.wikipedia.org တွင် အသုံးပြုမှု
- en.wikipedia.org တွင် အသုံးပြုမှု
- et.wikipedia.org တွင် အသုံးပြုမှု
- fi.wikipedia.org တွင် အသုံးပြုမှု
- fr.wikipedia.org တွင် အသုံးပြုမှု
- hr.wikipedia.org တွင် အသုံးပြုမှု
- ja.wikipedia.org တွင် အသုံးပြုမှု
- mn.wikipedia.org တွင် အသုံးပြုမှု
- no.wikipedia.org တွင် အသုံးပြုမှု
- pt.wikipedia.org တွင် အသုံးပြုမှု
- ru.wikipedia.org တွင် အသုံးပြုမှု
- simple.wikipedia.org တွင် အသုံးပြုမှု
- sq.wikipedia.org တွင် အသုံးပြုမှု
- ta.wikipedia.org တွင် အသုံးပြုမှု
- uk.wikipedia.org တွင် အသုံးပြုမှု
- ur.wikipedia.org တွင် အသုံးပြုမှု
- zh.wikipedia.org တွင် အသုံးပြုမှု
