
ဖိုင်:Hydrogen Density Plots.png

ဤနမူနာ၏ အရွယ်အစား - ၆၆၀ × ၆၀၀ ပစ်ဇယ်။ အခြား ပုံရိပ်ပြတ်သားမှု: ၂၆၄ × ၂၄၀ ပစ်ဇယ် | ၅၂၈ × ၄၈၀ ပစ်ဇယ် | ၈၄၅ × ၇၆၈ ပစ်ဇယ် | ၁၁၂၆ × ၁၀၂၄ ပစ်ဇယ် | ၂၂၀၀ × ၂၀၀၀ ပစ်ဇယ်။
မူရင်းဖိုင် (၂၂၀၀ × ၂၀၀၀ pixels, ဖိုင်အရွယ်အစား - ၁.၇၉ MB, MIME အမျိုးအစား image/png)
| ဤဖိုင်သည် Wikimedia Commons မှဖြစ်ပြီး အခြားပရောဂျက်များတွင် သုံးကောင်းသုံးလိမ့်မည်။ ယင်း၏ ဖိုင်အကြောင်းစာမျက်နှာ တွင် ဖော်ပြထားချက်ကို အောက်တွင် ပြထားသည်။ Commons သည် မူပိုင်ခွင့်လွတ်လပ်သော မီဒီယာဖိုင်များ သိုလှောင်ထားရာ နေရာ ဖြစ်သည်။ သင်လည်း ပါဝင်ကူညီနိုင်ပါသည်။ |
အကျဉ်းချုပ်
| ဖော်ပြချက် |
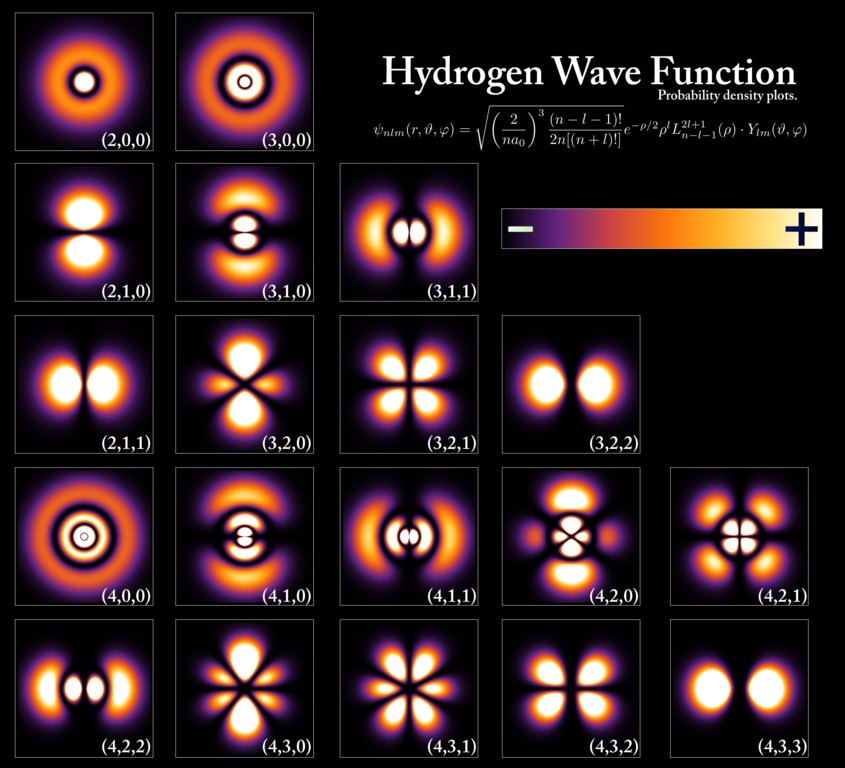
English: Hydrogen density plots for n up to 4.
Wavefunctions of the electron in a hydrogen atom at different energy levels. Quantum mechanics cannot predict the exact location of a particle in space, only the probability of finding it at different locations. The brighter areas represent a higher probability of finding the electron. |
||
| ရက်စွဲ | |||
| ရင်းမြစ် |
the English language Wikipedia (log).
|
||
| စာရေးသူ | PoorLeno (talk) | ||
| ခွင့်ပြုချက် (ဤဖိုင်ကို ပြန်လည်အသုံးပြုခြင်း) |
|
||
| အခြား ဗားရှင်းများ |
Derivative works of this file: |


ဖိုင်မှတ်တမ်း
ဖိုင်ကို ယင်းနေ့စွဲ အတိုင်း မြင်နိုင်ရန် နေ့စွဲ/အချိန် တစ်ခုခုပေါ်တွင် ကလစ်နှိပ်ပါ။
| နေ့စွဲ/အချိန် | နမူနာပုံငယ် | မှတ်တမ်း ဒိုင်မန်းရှင်းများ | အသုံးပြုသူ | မှတ်ချက် | |
|---|---|---|---|---|---|
| ကာလပေါ် | ၁၇:၄၆၊ ၁၂ မေ ၂၀၁၇ | | ၂၂၀၀ × ၂၀၀၀ (၁.၇၉ MB) | AkanoToE | Cleaned up the LaTeX wavefunction formula to be less rasterized. |
| ၁၀:၀၉၊ ၃ ဖေဖော်ဝါရီ ၂၀၀၉ |  | ၂၂၀၀ × ၂၀၀၀ (၁.၅၈ MB) | Ashik | == Summary == {{Information |Description=Hydrogen Density Plots for n up to 4. |Source=I created this work entirely by myself. |Date=17 August 2008 |Author=PoorLeno (talk) |other_versions= }} {{PD-self}} <!-- |
ဖိုင်သုံးစွဲမှု
ဤဖိုင်ကို အသုံးပြုထားသော စာမျက်နှာများမရှိပါ။
ဂလိုဘယ် ဖိုင်သုံးစွဲမှု
အောက်ပါ အခြားဝီကီများတွင် ဤဖိုင်ကို အသုံးပြုထားသည်-
- az.wikipedia.org တွင် အသုံးပြုမှု
- bcl.wikipedia.org တွင် အသုံးပြုမှု
- be.wikipedia.org တွင် အသုံးပြုမှု
- bh.wikipedia.org တွင် အသုံးပြုမှု
- bn.wikipedia.org တွင် အသုံးပြုမှု
- bs.wikipedia.org တွင် အသုံးပြုမှု
- ckb.wikipedia.org တွင် အသုံးပြုမှု
- de.wikipedia.org တွင် အသုံးပြုမှု
- de.wikibooks.org တွင် အသုံးပြုမှု
- el.wikipedia.org တွင် အသုံးပြုမှု
- el.wiktionary.org တွင် အသုံးပြုမှု
- en.wikipedia.org တွင် အသုံးပြုမှု
- Atomic orbital
- Electron
- Talk:Hydrogen atom
- Nature
- Quantum mechanics
- Energy level
- Schrödinger equation
- Wave function
- User:Patrick0Moran
- User:PoorLeno
- Theoretical and experimental justification for the Schrödinger equation
- Talk:Quantum mechanics/Archive 7
- Talk:Hydrogen/Archive 1
- Talk:Electron/Archive 3
- User talk:Sean.hoyland/Archive 1
- Quantum state
- User:Siva.tecz/sandbox
- Talk:Wave function/Archive 5
- User:Chickstarr404/Gather lists/13561 – The origins of Knowledge and Imagination by J. Bronowski
- Wikipedia:Reference desk/Archives/Science/2016 May 10
- User:Armanaziz/Nature
- Wikipedia:VideoWiki/C. V. Raman
- Wikipedia:Featured picture candidates/Hydrogen wave function
- Wikipedia:Featured picture candidates/March-2021
- User:Patcha007
- en.wikiquote.org တွင် အသုံးပြုမှု
- en.wikiversity.org တွင် အသုံးပြုမှု
- es.wikipedia.org တွင် အသုံးပြုမှု
- fa.wikipedia.org တွင် အသုံးပြုမှု
ဤဖိုင်ကို အခြားနေရာများတွင် အသုံးပြုထားမှုများအား ကြည့်ရှုရန်။